The following is a summary of PennHIP-related research published by Smith and colleagues. References to the actual publications are given at the end of each section.
Topics
|
Measuring Hip Joint Laxity
A unique method for the measurement of hip joint
laxity, using an index, was developed for the PennHIP compression
and distraction views. The method is quantitative (i.e., it assigns
a number to joint laxity) as opposed to being qualitative or 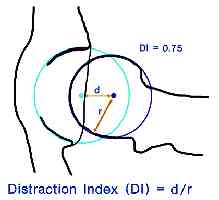 subjective
where an ordinal score is used (e.g. excellent, good, fair, etc.).
the former is not as vulnerable to inter- and intra-observer errors
commonly associated with subjective measurement systems.
subjective
where an ordinal score is used (e.g. excellent, good, fair, etc.).
the former is not as vulnerable to inter- and intra-observer errors
commonly associated with subjective measurement systems.
The index method is calculated by superimposing
precision-machined circle gauges on the cortical margins (rims)
of the acetabulum and femoral heads (see example at left) to find
the respective geometric centers. On the compression view (see below),
if the joint is free of osteoarthritis, the centers of the acetabulum
and femoral head should coincide indicating that the joint is indeed
concentric. On the distraction view, the distractive force causes
separation between the centers. The distance, d, between the centers
is a measure of hip joint laxity. However, d also varies with dog
size (larger dogs would likely have larger d’s than smaller dogs),
with age of the dog, and with magnification due to variation in
hip-to-film distance. To circumvent these potential sources of variation,
d is normalized with respect to all sizes of femoral heads and acetabula
by dividing it by the radius of the femoral head, r. The resulting
index, I = d/r, is a unitless number ranging from 0 to 1 (or more).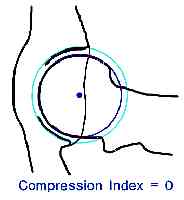 The
laxity index computed for the compression view is called a compression
index (CI), likewise, the laxity index for the distraction view
is called the distraction index (DI).
The
laxity index computed for the compression view is called a compression
index (CI), likewise, the laxity index for the distraction view
is called the distraction index (DI).
The distraction index (and the compression index) is a measurement of hip joint laxity. It does not allude to a passing or failing score. Hips with DIs on the distraction view that are close to 0 are considered to be tight, while DIs close to 1 are considered to be very loose. The DI is an indication of the “percent out of joint” that the femoral head is displaced from the acetabulum. For example, DI=0.58 means the femoral head comes out of the joint by 58%, DI=0.75, 75% out of joint (see schematic above), and so on. This also makes interpretation of the DI more intuitive: a hip with a DI=0.50 is twice as lax as a hip with a DI=0.25.
To obtain proper diagnostic radiographs, the musculature around the hip must be completely relaxed and so the dog must be under deep sedation or general anesthesia. Laxity as determined by the DI is therefore called passive hip laxity, as opposed to functional hip laxity which is the pathological form of hip laxity that occurs in dysplastic hips during weight bearing. (Clearly, functional hip laxity is of greater diagnostic interest, but there are presently no means to measure it.)
Reference
Smith GK, Biery
DN, Gregor TP. New concepts of coxofemoral joint stability and the
development of a clinical stress-radiographic method for quantitating
hip joint laxity in the dog. J Am Vet Med Assoc 1990;196(1):59-70.
Reliability of the Method
In a longitudinal study, dogs were radiographed in the standard hip-extended position and the compression/distraction position at 4, 6, 12, 24 and 36 months of age. The hip integrity was evaluated by three different methods.
- The hip-extended view was subjectively evaluated by a board-certified veterinary radiologist using the 7-point OFA scoring scheme (Excellent, Good, Fair, Borderline, Mild HD, Moderate HD, Severe HD).
- The hip-extended view was also evaluated quantitatively for laxity with the Norberg angle (NA). (Please refer to the reference at the end of this section for information about the NA.)
- The distraction view was evaluated for passive hip laxity as measured by the DI.
One of the objectives of this study was to assess each method’s diagnostic reliability over the different time periods. That is, the comparability, or closeness, of one measurement at one time period to the same type of measurement at a different period in time was investigated. The data were statistically analyzed using the intra-class correlation coefficient (ICC), a statistic that is used to determine comparability or “sameness” between groups of data. The ICC is a number ranging from -1 to 1. The closer the ICC is to 1, the greater the degree of comparability. (Note: a special type of ICC, called the kappa statistic, is used for categorical data such as the subjective scoring scheme. The interpretation of kappa is the same as for the ICC.)
The table below summarizes the main results. For brevity, only the results from the 4 month and 12 month readings compared to the reading at 24 months are given.
|
4 vs
24 months |
12 vs
24 months |
|
| Subjective (OFA) | 0.08* | 0.39 |
| Norberg Angle | 0.51 | 0.78 |
| Distr Index (DI) | 0.85 | 0.91 |
|
* indicates statistic not significant (at 0.05 level) |
||
The high ICC values derived from the distraction indices indicate that the DI was clearly more comparable than the corresponding subjective score (OFA score) or NA measurement. In other words, the DI at 4 months was much the same as the DI at 24 months. For this reason, the DI is considered the most reliable assessment of hip laxity for a dog as young as 16 weeks old. A similar study from an independent laboratory has recently been published confirming these results (see reference below). A recently published study from Penn of 8-week-old German shepherd puppies revealed that the DI, at 8 weeks, did not strongly correlate to DIs’ at 12 or 24 months of age. It was concluded that hip evaluation in German shepherd dogs should not begin before 16 weeks of age. Other breeds of dogs require similar longitudinal evaluation to determine the earliest meaningful age for radiographic testing. Interestingly, the OFA score at 4 months was not capable of predicting later hip score meaning that in this study there was no scientific support for using preliminary OFA score at 4 months as an early screening tool. Even when comparing 12-month OFA scores with 24-month OFA scores, the correlation of 0.39, although statistically significant, was too low to be clinically useful.
In Summary
The ability to receive an early estimate of a dog’s hip laxity is important whether the dog’s intended purpose will be for breeding, for working or as a family pet. The data, which are regularly compiled and analyzed, will allow breeders to identify the members of their breeding stock with the tightest hips, thereby facilitating optimum selection.
References
Smith GK, Gregor TP, Rhodes WH, Biery DN. Coxofemoral joint laxity from distraction radiography and its contemporaneous and prospective correlation with laxity, subjective score, and evidence of degenerative joint disease from conventional hip-extended radiography in dogs. Am J Vet Res 1993;54(7):1021-1042.
Adams WM, Dueland RT, Meinen J, O’Brien RT, Giuliano E, Nordhein EV: Early detection of canine hip dysplasia: comparison of two palpation and five radiographic methods. J Am An Hosp Assoc 1998; 34(4): 339-347.
The Risk of
Developing DJD
For more than 35 years, it has been empirically accepted that hip joint laxity is related to the development of DJD. However, prior to the research conducted at the University of Pennsylvania, there existed little or no scientific evidence to support this view. The problem was approached in two ways: First, the relationship of hip joint laxity with the coexistence of DJD in a cross-section of adult dogs was examined (cross-sectional study). Next, the relationship of laxity at an early age with the appearance of DJD at a later time was investigated (longitudinal study). The results are summarized below.
Cross-sectional Study
An analysis of 142 dogs (mean age of 20 months) showed a direct relationship of hip laxity (as determined by the DI) to the radiographic existence of DJD. Hips with low DI’s, i.e. “tight hips”, were very unlikely to exhibit DJD. In this study only one hip with a DI less than 0.30 exhibited any evidence of DJD (DI = 0.29). The converse was not true; that is, not all hips with a DI greater than 0.30 necessarily showed radiographic evidence of DJD. However, as the DI increased, there was an increase in the frequency of DJD. (see the graph below)
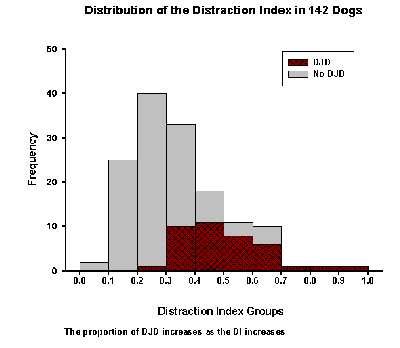
It is interesting to note that more than 50% of the hips in this study had distraction indices below 0.30, yet only one hip in this group < 0.30 showed any radiographic evidence of DJD. There appears to be a cut-off point – DI approximately 0.30 – below which the canine hips is not susceptible to getting DJD.
Longitudinal Study
In this study, dogs were radiographed at 4 months,
12 months, 24 months of age. A logistic regression model was invoked
to determine the contribution of factors such as DI, Norberg Angle
(NA), subjective score (OFA), weight and sex at 4, 12 or 24 months
to the risk of developing DJD at or before 3 years. The analysis
indicated that the DI at all age groups was the most significant
prognostic factor and that the strength of the predictive power
improved with age. The sex, weight, NA and subjective (OFA) score
were not found to be significant factors in this study.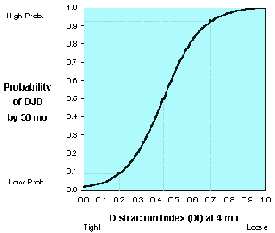
The graph at right is from a study involving German Shepherd dogs. It demonstrates how the DI at a given age is associated with the probability for developing DJD later on. The DI can be thought of as a risk factor for the development of DJD. Tight-hipped dogs (those with small DI’s) are at a low risk and loose-hipped dog’s (those with high DI’s) are at a high risk. In other words, the larger the DI (at 4 months), the greater the risk for developing DJD by three years of age.
The results represented in this graph are for German Shepherds. For example, a separate probability curve exists for Rottweilers. However, regardless of the breed, the “tight hip / loose hip” susceptibility to DJD still holds.
Note: The DI as a risk factor for the development of DJD is analogous to the association of serum cholesterol with the risk of developing heart disease. The higher a person’s cholesterol level, the greater is the risk that the person will develop heart disease. Not all individuals, however, with high cholesterol level will necessarily have heart disease. Yet to be on the safe side most people would choose to have low rather than high serum cholesterol levels because the odds are in their favor that low cholesterol means better cardiovascular health. Similarly tighter hips equate to greater DJD resistance.
References
Cross Sectional Study
Smith GK, Gregor TP,
Rhodes WH, Biery DN. Coxofemoral joint laxity from distraction radiography
and its contemporaneous and prospective correlation with laxity,
subjective score, and evidence of degenerative joint disease from
conventional hip-extended radiography in dogs. Am J Vet Res 1993;54(7):1021-1042.
Longitudinal Study
Smith GK, Popovitch CA, Gregor TP, Shofer FS. Evaluation of risk factors for degenerative joint disease associated with hip dysplasia in dogs. J Am Vet Med Assoc 1995;206(5):642-647.
Smith GK, Gregor TP, Rhodes WH, Biery DN. Coxofemoral joint laxity from distraction radiography and its contemporaneous and prospective correlation with laxity, subjective score, and evidence of degenerative joint disease from conventional hip-extended radiography in dogs. Am J Vet Res 1993;54(7):1021-1042.
See also
Lust G, Williams AJ, Burton-Wurster N, Pijanowski GJ, Beck KA, Rubin G, Smith GK. Joint laxity and its association with hip dysplasia in Labrador retrievers. Am J Vet Res 1993;54(12):1990-1999.
Heritability
Heritability is an important statistic relating the variation of a trait attributable to additive genetic effects with the total phenotypic variation of the trait. In other words, heritability relates the genetic basis of a disease or trait (the genotype) with what is actually expressed or observed (the phenotype). Heritability is expressed as a number between 0 and 1. The higher the heritability, the more the phenotype represents the genotype and the greater the rate of genetic change that can be derived from selection pressure. The accuracy of a diagnostic test to determine disease (in this case CHD) can have an impact on the the value of the heritability statistic. An inaccurate (highly variable) diagnostic test can effectively lower the estimate of heritability. Such high diagnostic variability is believed to explain the low calculated heritabilities of the subjective hip score (OFA).
The heritability of the hip phenotype scored in the hip-extended view by the OFA in the United States has not been studied and therefore no heritability figures have been published by the OFA. Two reports from the 1970’s using diagnostic phenotypes similar to the OFA estimated the heritability of such phenotypes to be low, less than 0.25 (see Jessen and Spurrel, 1973 and Leighton et al, 1977). PennHIP is working with many breed clubs with an interest in the heritability estimates for their particular breed. Estimates for the heritability of passive hip laxity (DI) drawn from analysis of full pedigrees for the breeds examined thus far have yielded high values, eg. for German Shepherd Dogs, heritability = 0.50; for Labrador Retrievers, heritability = 0.60 (see Leighton et al, 1977).
Reference
Leighton EA, Linn JM, Willham RL, et al . A genetic study of canine hip dysplasia. Am J Vet Res 1977;38:241-244.
Jessen CR, and Spurrel FA. Heritability of canine hip dysplasia, in Proceedings. Canine Hip Dysplasia Symp 1973;53-61.
Leighton EA, Smith GK, McNeil M, Gregor TP. Heritability of the distraction index in German shepherd dogs and Labrador retrievers, in Proceedings. Molecular Genetics and Canine Genetic Health Conference, American Kennel Club;1994 Oct 7-8.
Biomechanics of Canine Hip Laxity
A detailed survey of the biomechanical properties of the hip joint is beyond the scope of this document.
References
Heyman SJ, Smith GK, Cofone MA. Biomechanical study of the effect of coxofemoral positioning on passive hip joint laxity in dogs. Am J Vet Res 1993;54(2):210-215
Smith GK, LaFond E, Heyman SJ, Cofone MA and Gregor TP: Biomechanical characterization of passive laxity of the canine coxofemoral joint, Am J Vet Res, 1997;58:1078-1082.